Productivity and macroevolution

As plenty of crime dramas insinuate, if you want to understand a complex situation, you ought to follow the money. The currency of ecosystems is biomass (more strictly, embedded energy?) – and understanding biomass flows can account for a surprising variety of ecological trends and macroevolutionary phenomena.

Trophic 'pyramids'

Controls on body size

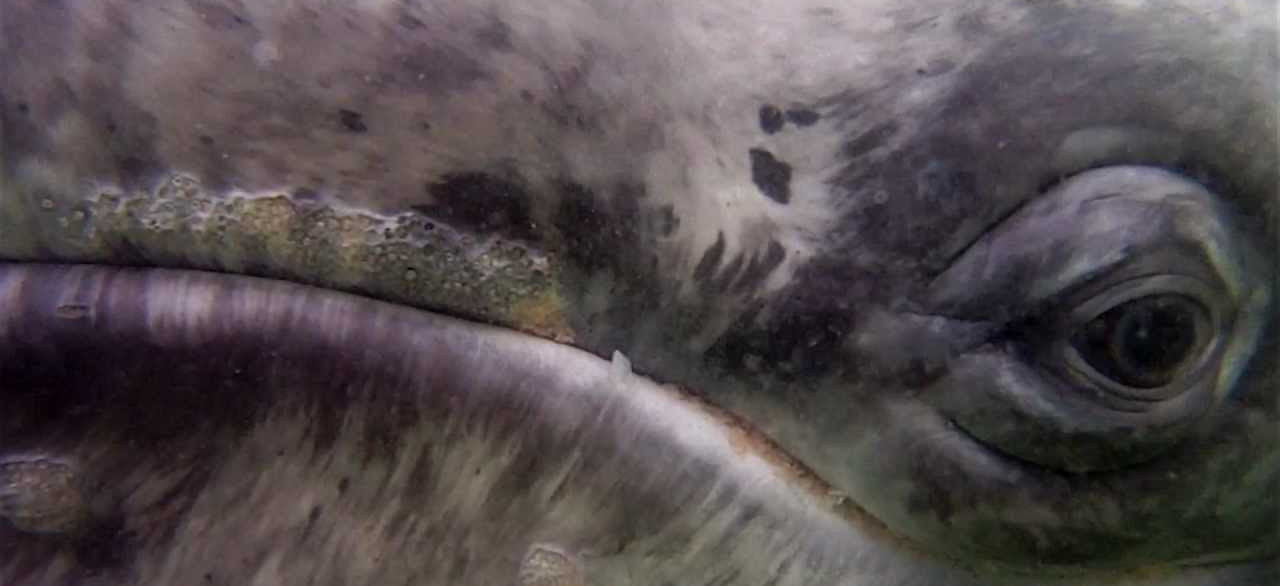
Maximum body size is an oft-discussed property of the palaeontological record. Cope’s law asserts (imprecisely and unprofoundly) that maximum body size tends to increase within a given lineage over geological time. But is there a physical limit to maximum body size, and are whales at it?

One upper bound on body size is given by the flow of energy up food chains. The largest animal needs to be able to find enough food to sustain it. And in the planktic realm (open oceans), predators are always larger than their prey – specialized prey-capture appendages would cause prohibitive drag, so swallowing is the only means of eating.

One might expect biomass to decrease up the Eltonian (trophic) pyramid: shouldn’t there be more whale food in the ocean than there is whale? What does the biomass distribution actually look like – a pyramid (upright or inverted)? An hourglass? A skyscraper?

  • List ten processes that would add to or reduce the amount of biomass at a certain size class (i.e. level in the trophic pyramid).
  • Think about processes that operate on different timescales (instants → seconds → hours → generations).

Shaping the pyramid

The shape of the trophic ‘pyramid’ represents a balance between a number of life-history traits, may of which scale with body mass:

Death rate a function of predator population abundance
Reproduction rate = death rate, at steady state
Feeding rate amount of energy consumed
Metabolic rate amount of energy lost as heat / waste
Growth rate (= energy in − energy metabolised?)

Note that 99% of marine animals die when they are eaten. This creates an implicit linkage between the feeding rate in one tier and the death rate in the tier below.

Before you watch the next video, suggest what relative values these factors would have to take to produce a steady-state trophic strucure in the shape of:

  • A pyramid
  • An inverted pyramid
  • A ‘skyscraper’

Production (i.e. rate of addition of particles) scales with particle size per the graph: the gradient is ⅔, not 1.

The constant gradient reflects a constant ratio of predator : prey size, constant “Particle-size-conversion” efficiency (gulp) and a constant growth efficiency (scaling of growth rate with mass).

The gradient isn’t one because 90% of energy is lost to inefficiency at each step up the food chain.

Lifespan, feeding and growth rate all reflect metabolic rate, which also scales with particle size (gradient: ¾). This is to say, larger organisms eat, grow, live and die more slowly, balancing their larger size.

Room at the top

If the trophic ‘pyramid’ is really a column or ‘skyscraper’, what controls its height?

The top storey of the trophic skyscraper must contain at least one individual. In practice, minimum viable population size is much larger: in the order of hundreds for terrestrial mammals (pandas) and hundreds of thousands for marine fish. There were about this many blue whales until we almost exterminated them through overfishing: there's nothing larger than a blue whale because a sustainable population of larger organisms would need to eat more food than the planet's oceans can produce.

Trophic pyramids in deep time

Macroevolutionary trends

Taller skyscrapers increase the standing crop of biomass ‘for free’: each additional storey can be sustained with no additional primary productivity.

And biomass really has increased through time: we can show that:

  • Cenozoic organisms are at least as common as Palaeozoic organisms were (at least if we consider the most common groups of organisms from each time period)
  • Cenozoic organisms had, on average, more biomass than Palaeozoic organisms – larger body size, and even at same body size, more of the body is ‘biomass’ rather than ‘space’
  • Does this indicate an increase in primary productivity, or could it simply be that Cenozoic organisms were more efficient than Cambrian ones?
Credit:

The “Starbucks effect”

Increasing efficiency?

Active modes of life have displaced efficient modes of life to nutrient-poor (oligotrophic) refugia – in order to see more fuel-efficient cars, just make fuel scarcer (dearer).

“High energy” lifestyles include active burrowing (pushing sediment aside is wasted energy), predation (failed pursuits waste energy).

These lifestyles can incidentally complicate the ‘easy’ lives of more efficient organisms. Interestingly, lineages do not tend to change their ‘energeticness’ / efficiency / effectiveness of nutrient capture very much as they evolve. Rather, new strategies for effective resource use evolve suddenly as a ‘new major group’ develops in a new trophic guild (which came first is an interesting question).

Indeed, lineages seem to show a trend to decreasing evolvability through time: all the ‘low hanging’ evolutionary fruit have been picked, and subsequent mutations are more likely to have a smaller effect. (cf. ‘key innovation’ model of evolution.)

As such, changes in energetics of organisms tend to represent the arrival of new, ‘caffeinated’ lineages (‘bullies’), which displace existing lineages into oligotrophic refugia. These new lineages are often members of the Recent Fauna (III), which predominantly comprise high-energy taxa; in the Palaeozoic, the high energy requirements of such taxa could only be met in the most productive places on Earth, but the across-the-board increase in productivity through the Recent meant that their high demands could be met in progressively more settings – whereas the low nutrient settings preferred by the Palaeozoic fauna were now found in settings that were previously too nutrient-scarce to support life at all.

This fits with the long-term picture: diversity is predominantly added into previously unoccupied guilds. Perhaps these were unoccupied because they were not energetically feasible, as not enough biomass was available to sustain them?
A short story: "The Starbucks Effect"

Once upon a time there was a sleepy college library in which a few students quietly worked. When the librarian installed a coffee machine, a new breed of students appeared. These students needed coffee to function. They elbowed the other students aside on their charge to the coffee machine, and talked animatedly about their work. They got lots done – but the old students didn't like it. They drifted away to find another quiet corner to work in.

  • Can you suggest biological counterparts for the processes alluded to in this slightly daft analogy?

Why did productivity rise?

If we're going to buy into the "productivity explains everything" perspective, this leaves an outstanding question: Did primary productivity truly rise through the Phanerozoic, and why?

  • How can we reconstruct primary productivity in deep time?
  • What are the key controls on primary productivity? How have they changed through time?
  • Questions?

    Use the "Ask" button to propose and topics to cover during the question and answer session. Give questions you'd like covered the "thumbs up".

    Suggestions for further reading

    See the reading list for electronic access to book chapters.

    Key Reading

    • * Bambach, R. K. (1993). Seafood Through Time: Changes in Biomass, Energetics, and Productivity in the Marine Ecosystem. Palaeobiology 19, 372–397.
    • Butterfield, N. J. (2007). Macroevolution and macroecology through deep time. Palaeontology 50, 41–55.
    • [Or:] Butterfield, N. J. (2011). Animals and the invention of the Phanerozoic Earth system. Trends in Ecology and Evolution 26, 81–87.
    • Further literature:

    • Signor, P. W., & Vermeij, G. J. (1994). The plankton and the benthos: origins and early history of an evolving relationship. Paleobiology 20, 297–319.
    • Payne, J.L. et al. (2009). Two-phase increase in the maximum size of life over 3.5 billion years reflects biological innovation and environmental opportunity. PNAS 106, 24–27. doi:10.1073/pnas.0806314106
    • On the mathematics of biomass flow:

    • Borgmann, U. (1987). Models on the slope of, and biomass flow up, the biomass size spectrum. Canadian Journal of Fisheries and Aquatic Sciences 44, s136–s140.
    • Sheldon, R. W., Prakash, A., & Sutcliffe, W. H. (1972). The size distribution of particles in the ocean. Limnology and Oceanography 17, 327–340.